Now we make a modeling assumption. Suppose that after being processed, water that is put back into the aquarium rapidly becomes mixed up with the unprocessed water. That is, assume that processed and unprocessed water is uniformly mixed within the aquarium instantly. This simplifying assumption is true at least in an average way. At times the in-flow water may have a higher proportion of unprocessed water than does the water within the tank. These times are balanced by times when the reverse is true; that is, when the in-flow water has a lower percentage of unprocessed water. On average though, the percentage of flow into the device that is unprocessed matches the percentage of water in the tank overall that is unprocessed.
Given this modeling assumption, at any moment in time, the total gallons of
unprocessed water in the tank is given by the amount of water that has
been through the device zero or more times minus the amount of water
that has been through the device one or more times:
![]() . The
result of this subtraction is just the total gallons of water that has
never been processed by the device. If we take this total, and divide by
the total volume of the tank, we arrive at the fraction of water in
the tank that has never been processed:
. The
result of this subtraction is just the total gallons of water that has
never been processed by the device. If we take this total, and divide by
the total volume of the tank, we arrive at the fraction of water in
the tank that has never been processed:
The next question we ask: what is the rate at which unprocessed water is
being converted to processed water? This is really just a question of
how fast ![]() is getting larger. To put this a little more formally, so
that we can apply techniques of calculus to solve this problem, let
is getting larger. To put this a little more formally, so
that we can apply techniques of calculus to solve this problem, let
![]() represent the rate at which water is being converted from
unprocessed to processed. If the device that is processing the water has
a flow rate of
represent the rate at which water is being converted from
unprocessed to processed. If the device that is processing the water has
a flow rate of ![]() , then unprocessed water flows from the tank into
the device at a rate given by the expression
, then unprocessed water flows from the tank into
the device at a rate given by the expression
|
|
(4) |
Consider the function
If we show ![]() also satisfies the differential equation
(6), then
also satisfies the differential equation
(6), then
![]() must actually be the one and only function
that satisfies equations (6-7) and so
must actually be the one and only function
that satisfies equations (6-7) and so
![]() .
.
Recall from calculus that
![]() , and
that the derivative of a constant
, and
that the derivative of a constant
![]() is zero. It follows that
is zero. It follows that
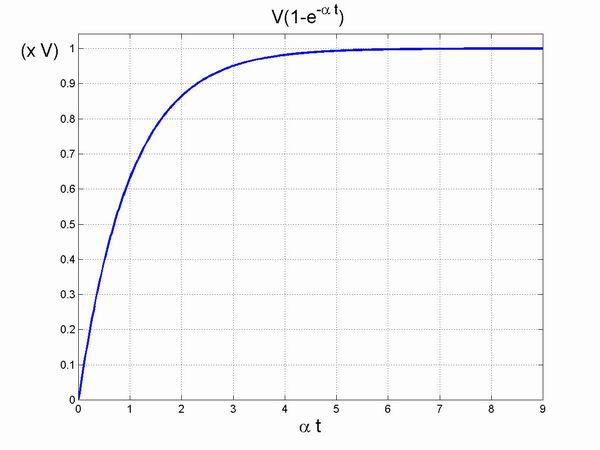
From the plot below, one can easily see that as
![]() increases (and so
increases (and so
![]() increases),
increases),
![]() approaches
approaches
![]() . Also note that
. Also note that
![]() , as
expected.
In the plot, observe that when
, as
expected.
In the plot, observe that when
![]() ,
,
![]() . This is tank volume divided by flow rate, and is
at first glance a seemingly reasonable estimate of turn-over time.
However, when
. This is tank volume divided by flow rate, and is
at first glance a seemingly reasonable estimate of turn-over time.
However, when
![]() , the plot below shows that there is about
, the plot below shows that there is about
![]() of tank water left unprocessed! Time
of tank water left unprocessed! Time
![]() is clearly a poor
estimate of turn-over time.
is clearly a poor
estimate of turn-over time.